
RNA m7G Modification Profile (MeRIP-Seq)
Antibody-based enrichment of m7G-carrying fragments. A transcript-level profile of where m7G sits — with one boundary that has to be kept in view: this route does not separate the cap from the transcript body.
01What the service reports
RNA m7G Modification Profile (MeRIP-Seq) is an antibody-based enrichment service. Fragments carrying m7G are captured with an anti-m7G antibody, sequenced and mapped back to the transcriptome, producing a region-level profile of m7G enrichment.
m7G occurs in two settings: at the 5′ cap, where it is a normal part of cap structure, and internally, where it is a regulatory mark. Both settings contribute to the same antibody pull-down, and this route does not separate them. The profile therefore reports combined m7G enrichment, and the split between cap and internal signal is an interpretation question rather than something the data itself resolves.
Within that boundary the method is a workable way to compare m7G status across samples and to identify transcripts whose m7G signal differs. Regions of interest are usually followed up with a chemistry-based method. Arraystar delivers the workflow end to end, from RNA QC to the mapped profile.
02Benefits
- Transcript-level coverage: the profile reports m7G enrichment across transcripts rather than at a single position.
- Comparison-friendly: enrichment data from many samples can be compared directly, which suits surveys of m7G status across conditions.
- Clear statement of scope: the combined cap-and-internal nature of the signal is reported with the result, so the profile is read with the right expectations.
- Direction for follow-up: enriched regions are the natural starting points for a chemistry-based, position-level method.
- Service to analysis: enrichment, library construction, sequencing and the analysis set are delivered as one workflow.
| Service Name | RNA Class | Price |
|---|---|---|
| RNA m7G Modification Profile (MeRIP-Seq) | mRNA | |
| RNA m7G Modification Profile (MeRIP-Seq) | mRNA and lncRNA |
03Background and detection principle
The workflow fragments RNA, captures m7G-containing fragments with an anti-m7G antibody, and sequences the captured pool next to an input control. Regions that appear enriched relative to input are reported as the m7G profile.
The boundary is chemical rather than technical. m7G at the cap and m7G in the transcript body are the same modification, so the antibody cannot tell them apart by binding. What the analysis delivers is therefore the sum of the two, and any statement about one of them depends on additional evidence from outside this workflow. Stated up front, that limit keeps the comparison honest and points to where a position-level method adds value.
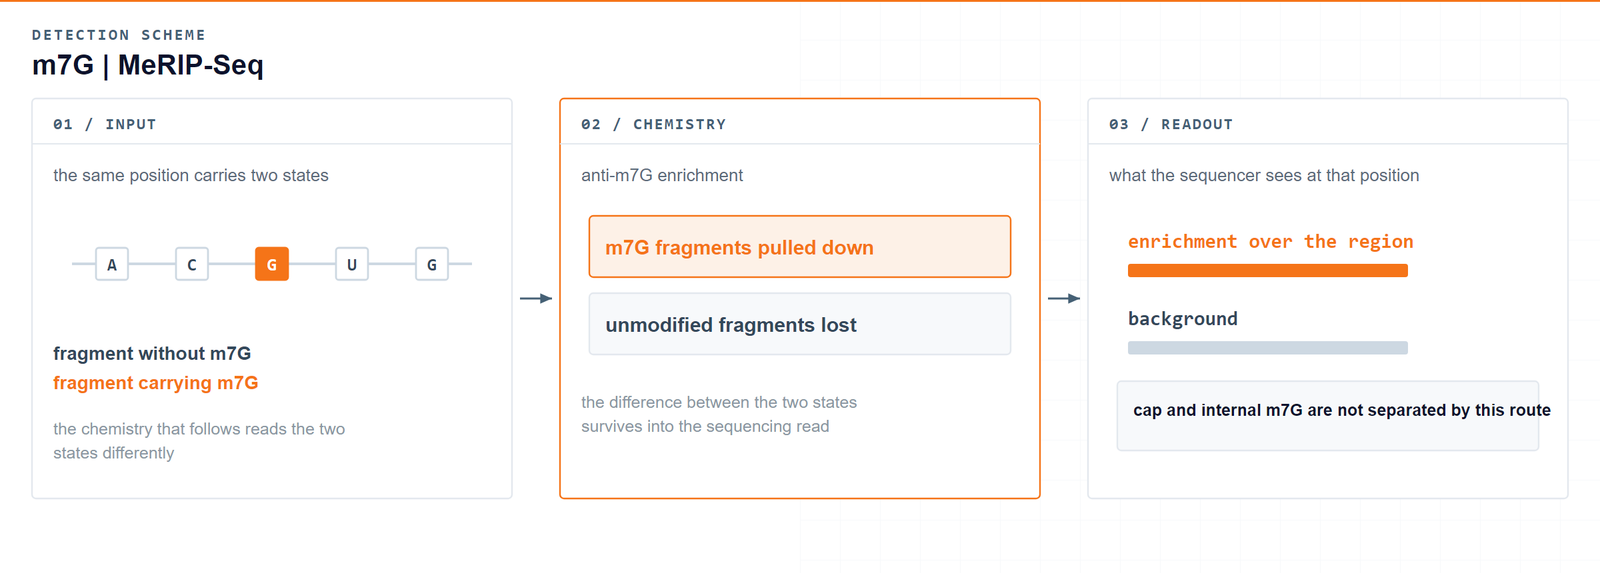
One pull-down, two pools: the m7G profile reports cap and internal signal together, and says so.Zhang LS. et al., Molecular Cell 2019 · DOI 10.1016/j.molcel.2019.03.036
04Workflow
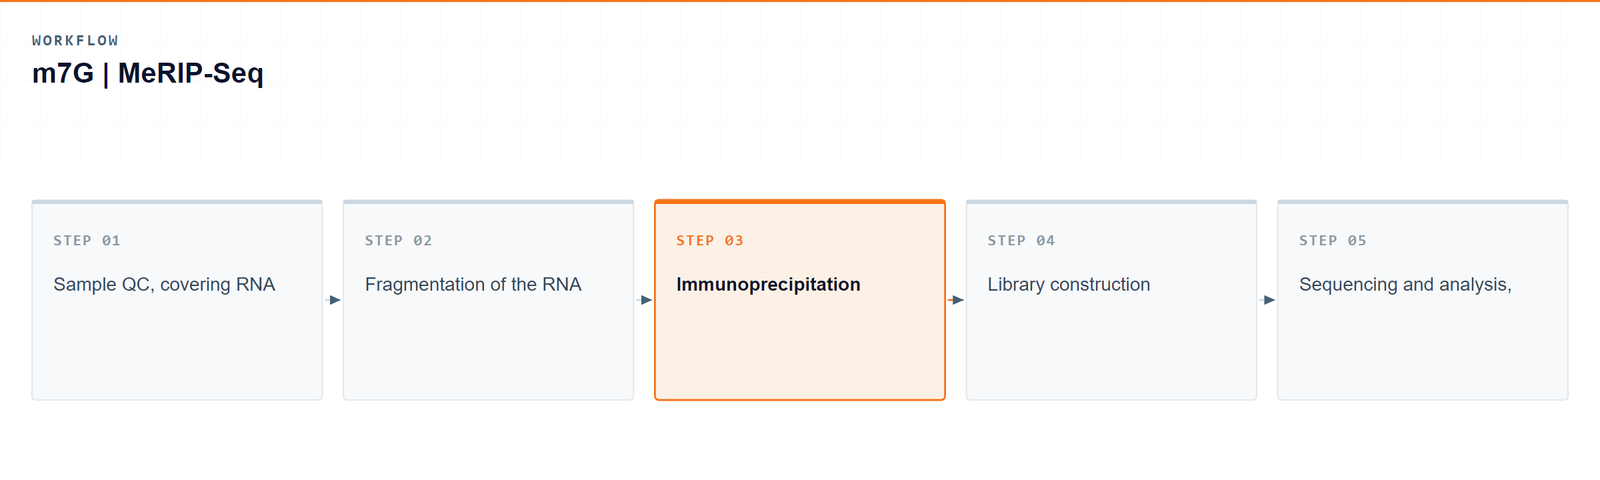
The service follows five steps from sample to mapped m7G profile:
- Sample QC, covering RNA integrity and purity.
- Fragmentation of the RNA for antibody capture.
- Immunoprecipitation with an anti-m7G antibody alongside an input control.
- Library construction from the enriched and input fractions.
- Sequencing and analysis, reported as a combined cap-and-internal m7G profile.
05Bioinformatics and deliverables
Reads are mapped and enriched regions are called against input, then annotated. The analysis set covers enrichment peaks, their distribution over transcript features, differential enrichment between sample groups and genome-browser visualization.
Deliverables
- Raw m7G mRNA enrichment sequencing data files (FASTQ), formatted for GEO/SRA submission.
- QC reports and sorted, indexed BAM alignment files with core mapping statistics.
- m7G enrichment peak tables (XLSX) with genomic coordinates and annotated host genes.
- Peak distribution plots over transcript features (PDF/PNG).
- Differential m7G enrichment tables (XLSX) between sample groups.
- Genome-browser signal tracks (bigWig/bedGraph) and a structured project report.
06Research applications
- m7G regulator studies: comparing samples in which a writer or eraser has been perturbed shows how the combined m7G profile responds.
- Cancer and proliferation work: m7G has been linked to translation and growth, so tumour and normal or treated and untreated samples are common comparisons.
- Stress response: conditions that change translation can be surveyed for m7G differences across transcripts.
- Survey before site-level work: a combined profile is a reasonable way to choose the transcripts worth resolving further.
- Cross-modification studies: m7G can be read alongside other modification profiles from the same material to compare how marks move together.
07Sample requirements
Storage. Cells and tissues: preserve in TRIzol or an RNA stabilisation solution, snap freeze in liquid nitrogen and store at −80 °C. RNA: resuspend in ethanol or RNase-free ultrapure water, store at −80 °C and avoid repeated freeze–thaw cycles.
Shipping. Place the sample in an RNase-free microcentrifuge tube, seal it against leakage, and ship on dry ice with adequate insulation.
| Sample type | Notes |
|---|---|
| Whole blood | EDTA tubes only; heparin is not compatible with the downstream procedure. |
| Cultured cells | Cell pellets are preferred. |
| Tissue | Fresh or frozen specimens; avoid necrotic material. |
| Total RNA | OD 260/280 ≥ 1.8 and RIN ≥ 7, with no visible degradation. Submit more than 10 µg total RNA. |
08FAQ
What if the study needs the position rather than the profile?
Then the work moves to single-base resolution. Alongside this profile, Arraystar provides m7G sequencing at single-base resolution (m7G-Quant-seq), which separates internal sites from the cap and reports the position and level of each one, so the transcripts flagged here can be resolved individually.
Does this profile separate cap m7G from internal m7G?
No, and that is the single most important caveat for this method. Both pools carry the same modification and both are captured by the antibody, so the profile reports them together.
How should I interpret an enriched region then?
Treat it as m7G signal at that transcript or region, without assuming whether it comes from the cap or from the internal mark. Additional evidence is needed to make that call.
Is the method single-base resolved?
It is not. Enrichment localises signal to a region of a transcript, so the output is a profile rather than a resolved nucleotide.
When is a chemistry-based method a better start?
When the question concerns a specific position or a specific pool of m7G, a chemistry-based route is the better starting point. The enrichment profile works well as a first look across samples.
Which samples can be submitted?
Total RNA, cultured cells, tissue or blood, subject to the quality thresholds listed on this page.
09References
- Zhang LS, Liu C, Ma H, et al. Transcriptome-wide mapping of internal N7-methylguanosine methylome in mammalian mRNA. Molecular Cell 2019;74:1304–1316. DOI: 10.1016/j.molcel.2019.03.036